South Australian Nuclear Fuel Cycle Royal Commission
The key objective of this study was to quantify the relative economic viability of integrating nuclear
power generation technologies as one of a suite of renewable and fossil fuel power generation
technologies within the National Electricity Market (NEM).
DGA Consulting partnered with Carisway to deliver a comparative analysis of the relative viability of a small (285MW) and a large (1,125 MW) nuclear generator in comparison with CCGT (374 MW) or a CCGT with CCS (327 MW). The analysis assumed plant was commissioned in South Australia in either 2030 or 2050.
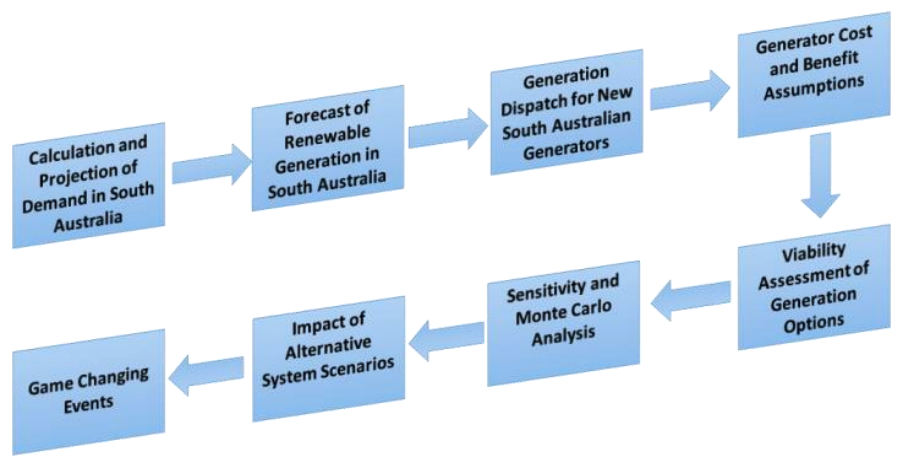
The key project steps are shown in the chart below.
Step 1 – Calculation and Projection of Demand in South Australia
Demand was segregated into customer categories and projected forward for the years 2030 and 2050 on a half hour basis with the option of selecting different growth assumptions for each consumer category and for electric vehicles.
Step 2 – Projections of Renewable Generation in South Australia
The modelling calculated the generation mix that could be used to meet the demand calculated in Step 1 on a half hour basis. This is shown in the diagrams below for days in October and February and demonstrates the significant difference in demand and the generation provided by renewables.
Step 3 – Generation Dispatch for New South Australian Generators
The model calculates the amount of generation that could be dispatched from each new generator based on the demand projections, dispatch schedules and interconnector capacity limitations.
Step 4/5 – Generator Cost and Benefit Assumptions / Viability Assessment
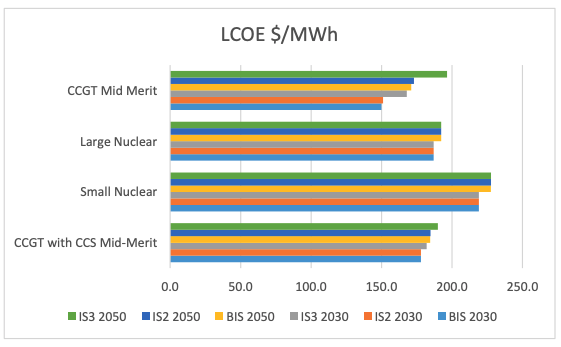
A series of data on generator construction costs, variable and fixed operations cost, plant efficiency and fuel/carbon costs were collected from cited public domain documents or Royal Commission research. In combination with the generation dispatch schedule created above a schedule of the NPV and Levelised Cost of Energy (LCOE) was generated for each generation option.
This is shown for a range of climate change and carbon price options (BIS, IS2, IS3) with a similar analysis also undertaken for the Levelised Price of Energy (LPOE) to reflect varying wholesale prices.
Step 6 – Sensitivity and Monte-Carlo Analysis
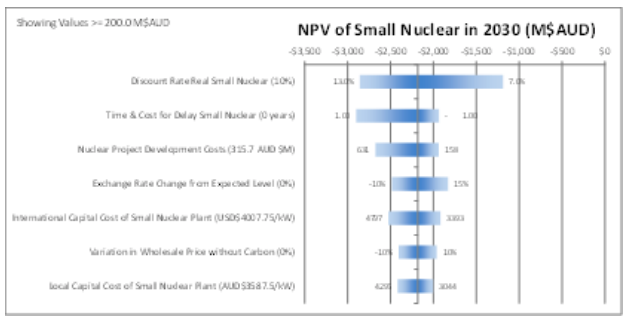
The modelling recognised that there was uncertainty around a number of key parameters such as construction cost, discount rate, fuel costs, carbon price and wholesale cost. Two forms of sensitivity analysis were undertaken. The first approach assessed the impact on the modelling results from changing a single key parameter from its most likely to a high/low extreme.
The second analysis is a Monte-Carlo simulation to predict the range of potential outcomes with an example shown below.
Step 7 – Impact of Alternative System Scenarios
The modelling included an assessment of alternative system scenarios that could fundamentally alter the commercial viability of the generation options. This included varying levels of demand and renewables growth in South Australia and the adoption of a social rather than commercial discount rate. This latter scenario did materially change the business case as is shown in the Monte-Carlo analysis with the left-hand chart reflecting outcomes with a commercial rate of 10% and the righthand chart showing the simulation results if a social discount rate of 4% was applied.
Step 8 – Game Changing Events
The final set of analysis was ‘game changing’ events that will have a fundamental impact on the viability of different generation options. This could include material changes in the costs of technology, cost of capital, carbon prices, fuel costs or the design of wholesale electricity markets and assessment of how this impacted the NPV of each option.


